Learn · Updated
Waveform vs Spectrum Visualisers
Short answer: A waveform visualiser shows how loud the audio is over time, while a spectrum visualiser shows how much energy is in each frequency band at a given moment; waveforms suit speech and simple clips, spectrums suit music where bass and treble should move separately.
Waveform and spectrum are the two most common kinds of music visualiser. They are built from different measurements and look and behave differently.
The short answer
| Waveform | Spectrum | |
|---|---|---|
| Shows | Amplitude (loudness) over time | Energy per frequency band at one moment |
| Horizontal axis | Time | Frequency, low to high |
| Typical look | A line, mirrored shape or row of bars that pulses | Bars or a curve where bass and treble move separately |
| Built from | Raw samples or RMS level | FFT analysis |
| Best for | Speech, podcasts, minimal designs | Music, especially with strong bass |
Waveform visualisers
A waveform plots the audio signal’s amplitude. There are two common forms:
- Overview waveform: the whole file at once, like the display in an audio editor or the wavesurfer.js player. It shows structure: intros, drops and quiet sections.
- Live waveform: a short window that updates every frame, as in a podcast audiogram, where the line ripples with the voice.
Because a waveform reflects overall loudness, a bass-heavy track and a vocal track at the same level can look similar. That makes waveforms clean and readable but less expressive for music. Browse waveform visualisers or waveform video makers.
Spectrum visualisers
A spectrum visualiser runs a Fast Fourier Transform (FFT) on each slice of audio and draws the energy in each frequency band. A kick drum lifts the bars on the left, a hi-hat flickers the bars on the right, and a sustained chord holds up the middle.
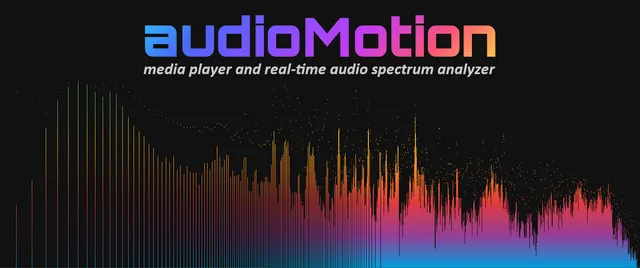
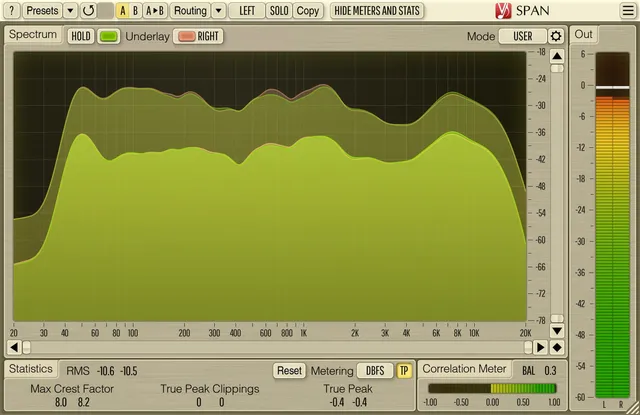
Decorative spectrum visualisers group frequencies into a few dozen bars and apply smoothing so they look good. Technical analysers such as Voxengo SPAN or audioMotion prioritise accuracy, with logarithmic axes, decibel scales and fine resolution. Browse spectrum visualisers.
Related displays
- Spectrogram: a spectrum plotted over time as a heat map. Useful for analysis, such as spotting where a lossy encoder cut the high frequencies. See spectrogram software.
- Oscilloscope: a detailed live waveform, or in XY mode, a plot of left against right channel. See What is an oscilloscope visualiser?
- VU and loudness meters: a single level value, not a shape. Tools such as MiniMeters combine meters with waveform and spectrum views.
Which should you use?
- For a podcast or spoken-word clip, use a waveform. It reads clearly and suits captions.
- For a music release video, a spectrum usually looks more alive, especially for electronic and bass-led music.
- For mixing and mastering, use a technical spectrum analyser plus a spectrogram.
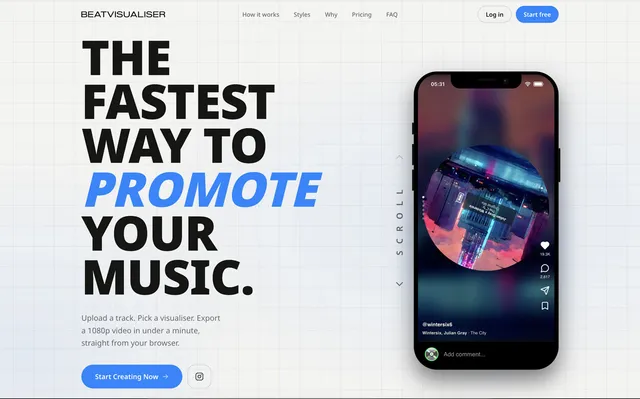
- For a distinctive look, combine them: many tools, including BeatVisualiser, let you choose waveform, spectrum, vinyl or oscilloscope-style layouts in one project.
Frequently asked questions
Which is better for a music video, waveform or spectrum?
Spectrum visualisers are usually more engaging for music because bass, mids and treble move independently. Waveforms are simpler and read well for speech, podcasts and minimal designs.
Is an equaliser display the same as a spectrum visualiser?
In everyday use, yes. The "equaliser bars" on stereos and media players are spectrum displays. Technically, an equaliser is a tool that changes frequency balance, while a spectrum analyser only displays it.